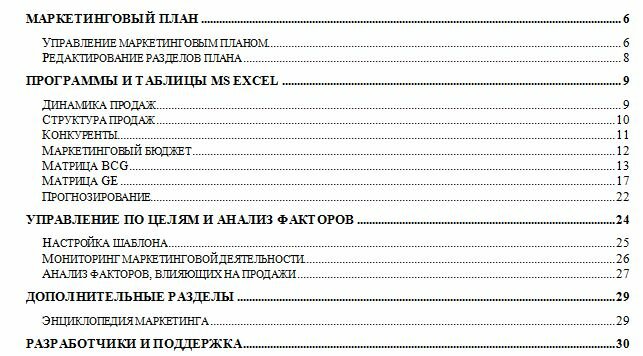
Инструментарии для работы отделов маркетинга. Marketing Mix 3 Pro и MM4XL 9
Сборка простых шаблонов и примеров в Excel часто требующихся для работы отдела маркетинга и продаж, Маркетинговый план, Учебники и справочная система.

Marketing Manager for Excel.
MM4XL is a comprehensive collection of business analysis software tools used to make professional strategic management decisions. In MM4XL software you will find lots of marketing examples, detailed explanations of management theories, and a comprehensive suite of strategic management software tools all in one single Excel add-in.
Tools for Product Portfolio Analysis
|
The McKinsey Matrix is the optimal solution to summarize the portfolio in terms of market attractiveness and product competitiveness. It can be used for products, or projects, which have not been launched yet. |
|
The BCG Matrix is the perfect tool to summarize, in one single bubble chart, a whole product portfolio in terms of competitiveness and cash flow. |
Benchmark Map is an easy tool used to rank performance, for instance, of several products according to the performance of the market they are in. |
Tools for Strategic Analysis |
|---|
|
The Brand Mapping tool extracts the deep meaning of data and makes it visible with bubble maps. |
|
This tool makes low-cost estimates of brand-switch and retention (loyalty) rates using very common time series sales data referred to direct competing brands. |
Profile Manager estimates the market share of several competing products in accordance with customer preference data concerning the basic product attributes, such as price, breadth of distribution, investments, and so on. |
Tools for Decision Analysis |
|---|
|
Risk Analyst can apply Monte Carlo simulation to virtually any business scenario built in MS Excel. |
Decision Tree help you select the best alternative among several options. |
Tools for Segmentation |
|---|
|
Cluster Analysis is perhaps the most common technique to find meaningful groups in the data. |
|
This tool finds homogeneous groups from the whole dataset and compares them with groups with the selected characteristic. |
Gravity Analysis calculates the area, for instance in kilometres, from which an outlet is more likely to draw its customers. |
Tools for Survey Analysis |
|---|
|
When the survey data has been gathered, use CrossTab to make highly professional contingency tables. |
|
One of the first questions to answer when designing a new survey is ?How many interviews are needed for a representative sample?? With Sample Manager finding the answer is easy and methodologically sound. |
|
Say that during a survey, concept A of your new advertisement is preferred by 29% and concept B is preferred by 34% of the sample. Proportion Analyst can tell you if the preference for concept B is statistically valid, which means that B was ‘really’ preferred. |
|
This tool makes the popular Pareto analysis (ABC), it makes box-plot charts, and provides descriptive statistics. |
This tool is used to compare performance, for instance, the sales growth of three competing products across five geographic regions. |
Tools for Forecasting & Trend Analysis |
|---|
|
This tool makes forecasts for the short-run using time series data. It can be very useful for projecting sales and production needs, and it also estimates the effect of special events, such as promotional activities. |
Quality Manager supplies all the tools needed to perform accurate, fast, and visually effective Statistical Quality Control. |
Tools for Charts & Maps |
|---|
|
Smart Mapping makes useful bubble maps that depict trends and associations in the data. |
|
Semantic Differential draws charts with vertical lines that are helpful when analysing product profiles, attitude, performance, satisfaction, and other connotative variables. |
|
4D Map draws a bubble chart in a 3D environment, in order to render more information than a common 2-dimensional chart. |
|
This charting tool shows several data series on the same chart, with each series in its own portion of the plot area. This way the series never overlap and the chart is more readable. |
![]() Project Map – Mind Mapping
Project Map – Mind Mapping
With this tool you can make mind maps, which are maps used to communicate ideas in a clear graphical format with strong visual impact.
СКАЧАТЬ/DOWNLOAD:
Protected content.
Теги:excel, Маркетинг, пример, шаблон
Trackback с вашего сайта.


Комментарии (10)
Какой пароль ?
ru-board
Спасибо конечно, но проблема в том что с rapidshsare скачать невозможно а так хочется!!!! Загрузите пожалуйста на другой файлообменник буду очень признателен.
загружу на днях на другой файлообменник. а в чем проблема с рапидшейром? у всех оттуда нормально качает же
пишет “Скачивание невозможно
Для этого файла не включена опция “загрузка”. Опцию “загрузка” может включить только скачавший этот файл пользователь.” Еще раз спасибо.
готово, все должно качаться с рапидшейра без регистрации
благодарствую, скачал. У вас просто замечательный сайт маркетинге!
спасибо!
Спасибо!!!
MM4XL 8 ссылка не рабочая. Спасибо за материал!